things on whoscored, certain stats didn't add up but I deciphered the shots and goals into the proper situation and totals. Just so we are clear open play and set piece
are based on Opta's definition. Set piece shots and goals do not include penalties.
Reliability
First thing I like to look at is how reliable a metric is. Given that I only have the year over year stats, this how will we analyze the data.
Reliability tells us to what degree we can expect a team to repeat its performance of a metric in the next season.


Open Play Shots For: 79% Skill vs 21% Luck
Set Piece Shots For: 68% Skill vs 32% Luck
We can do a good job of predicting each type of shot situation from one year to the next. If you are a good open play shot team this year
we can reasonably expect you will be good again next year. Same goes for set piece just with slightly less accuracy.
we can reasonably expect you will be good again next year. Same goes for set piece just with slightly less accuracy.
Now the reliability is good know when analyzing teams but we want to make sure that the metrics can explain and/or
predict things that lead to winning. In our case, goals.
predict things that lead to winning. In our case, goals.
Explaining Goals For
How well do open play/set piece shots explain goals for in the same season.


This is quite interesting. Open play shots correlate strongly at the end of the season with goals while, surprisingly, set piece shots
have literally no correlation. Basically, open play shots give you a significantly better indication of what teams scored the most
or least goals in a Premier League season.
have literally no correlation. Basically, open play shots give you a significantly better indication of what teams scored the most
or least goals in a Premier League season.
Predicting Goals in yr2
Finally, we will see how well open play and set piece shots predict future goals.
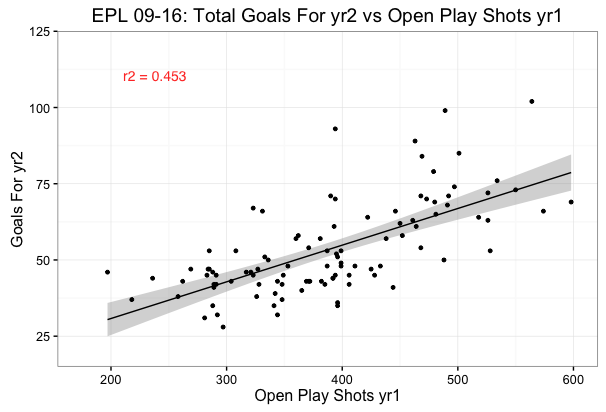

Again, we see open play shots providing us with a far superior correlation. Set piece shots provide us with literally no insight into
future goal-scoring performance.
This led me to wonder how reliable are set
piece and open play goals? And how well do they correlate to with Total Goals? What about the conversion rates?
piece and open play goals? And how well do they correlate to with Total Goals? What about the conversion rates?
I am not going to plot these but here are the correlations:
Open Play Goals, yr2 vs yr1: r2 = 0.525
Set Piece Goals, yr2 vs yr1: r2 = 0.05
Total Goals yr1 vs Open Play Goals, yr1: r2 = 0.83
Total Goals yr1 vs Set Piece Goals, yr1: r2 = 0.21
Open Play Conv Rate, yr2 vs yr1: r2 = 0.243
Set Piece Conv Rate, yr2 vs yr1: r2 = 0.000
Thoughts
Focusing on open play looks to be the most efficient way to score goals and win football matches. They are more reliable, explanatory, and
predictable at every turn.
predictable at every turn.
Call me Roberto Martinez but I am struggling to see the value in set pieces. Not only do they not correlate with total goals but
set piece goals are highly, highly variable from one season to the next. In fact, at best bet we can expect teams to revert right
back to the league average the following year.
Granted this is a very macro look at two sub-groups of shots but at first glance all I am seeing is how much more important open
play is in the Premier League.
play is in the Premier League.
Data
Here are the numbers I worked with so you can play around and replicate the findings above.
| Year | Team | Set Piece | Total Open Play | Total Goals | Set Piece Goals | Total Open Play Goals | Open Play Conv Rate | Set Piece Conv Rate |
|---|---|---|---|---|---|---|---|---|
| 09-10 | Arsenal | 164 | 492 | 79 | 16 | 56 | 0.114 | 0.098 |
| 09-10 | Aston Villa | 172 | 317 | 51 | 16 | 24 | 0.076 | 0.093 |
| 09-10 | Birmingham | 159 | 289 | 38 | 14 | 20 | 0.069 | 0.088 |
| 09-10 | Blackburn | 224 | 262 | 40 | 21 | 14 | 0.053 | 0.094 |
| 09-10 | Bolton | 218 | 336 | 46 | 20 | 14 | 0.042 | 0.092 |
| 09-10 | Burnley | 133 | 320 | 44 | 4 | 30 | 0.094 | 0.030 |
| 09-10 | Chelsea | 224 | 598 | 100 | 17 | 70 | 0.117 | 0.076 |
| 09-10 | Everton | 186 | 395 | 59 | 17 | 31 | 0.078 | 0.091 |
| 09-10 | Fulham | 151 | 308 | 43 | 9 | 20 | 0.065 | 0.060 |
| 09-10 | Hull | 132 | 248 | 39 | 12 | 11 | 0.044 | 0.091 |
| 09-10 | Liverpool | 175 | 464 | 60 | 14 | 39 | 0.084 | 0.080 |
| 09-10 | Manchester City | 159 | 362 | 74 | 21 | 46 | 0.127 | 0.132 |
| 09-10 | Manchester United | 153 | 534 | 76 | 13 | 57 | 0.107 | 0.085 |
| 09-10 | Portsmouth | 160 | 367 | 37 | 12 | 16 | 0.044 | 0.075 |
| 09-10 | Stoke | 203 | 197 | 34 | 14 | 16 | 0.081 | 0.069 |
| 09-10 | Sunderland | 131 | 304 | 48 | 9 | 29 | 0.095 | 0.069 |
| 09-10 | Tottenham | 210 | 468 | 67 | 17 | 48 | 0.103 | 0.081 |
| 09-10 | West Ham | 168 | 372 | 50 | 18 | 19 | 0.051 | 0.107 |
| 09-10 | Wigan | 156 | 396 | 37 | 10 | 24 | 0.061 | 0.064 |
| 09-10 | Wolverhampton Wanderers | 150 | 284 | 31 | 12 | 11 | 0.039 | 0.080 |
| 10-11 | Arsenal | 168 | 479 | 71 | 9 | 56 | 0.117 | 0.054 |
| 10-11 | Aston Villa | 158 | 342 | 46 | 9 | 31 | 0.091 | 0.057 |
| 10-11 | Birmingham | 137 | 262 | 41 | 16 | 15 | 0.057 | 0.117 |
| 10-11 | Blackburn | 182 | 269 | 43 | 18 | 22 | 0.082 | 0.099 |
| 10-11 | Blackpool | 152 | 371 | 59 | 17 | 25 | 0.067 | 0.112 |
| 10-11 | Bolton | 194 | 371 | 50 | 14 | 32 | 0.086 | 0.072 |
| 10-11 | Chelsea | 219 | 518 | 69 | 18 | 43 | 0.083 | 0.082 |
| 10-11 | Everton | 180 | 396 | 52 | 14 | 31 | 0.078 | 0.078 |
| 10-11 | Fulham | 150 | 394 | 53 | 17 | 24 | 0.061 | 0.113 |
| 10-11 | Liverpool | 147 | 428 | 61 | 11 | 38 | 0.089 | 0.075 |
| 10-11 | Manchester City | 143 | 394 | 58 | 13 | 37 | 0.094 | 0.091 |
| 10-11 | Manchester United | 150 | 463 | 76 | 13 | 58 | 0.125 | 0.087 |
| 10-11 | Newcastle United | 169 | 333 | 57 | 20 | 28 | 0.084 | 0.118 |
| 10-11 | Stoke | 221 | 258 | 46 | 18 | 21 | 0.081 | 0.081 |
| 10-11 | Sunderland | 135 | 392 | 43 | 8 | 29 | 0.074 | 0.059 |
| 10-11 | Tottenham | 203 | 446 | 54 | 12 | 35 | 0.078 | 0.059 |
| 10-11 | West Bromwich Albion | 166 | 425 | 58 | 11 | 33 | 0.078 | 0.066 |
| 10-11 | West Ham | 167 | 399 | 43 | 13 | 21 | 0.053 | 0.078 |
| 10-11 | Wigan | 123 | 385 | 36 | 9 | 25 | 0.065 | 0.073 |
| 10-11 | Wolverhampton Wanderers | 167 | 289 | 47 | 16 | 24 | 0.083 | 0.096 |
| 11-12 | Arsenal | 154 | 480 | 79 | 8 | 59 | 0.123 | 0.052 |
| 11-12 | Aston Villa | 150 | 285 | 39 | 3 | 29 | 0.102 | 0.020 |
| 11-12 | Blackburn | 159 | 286 | 47 | 19 | 18 | 0.063 | 0.119 |
| 11-12 | Bolton | 153 | 336 | 43 | 13 | 23 | 0.068 | 0.085 |
| 11-12 | Chelsea | 169 | 497 | 64 | 14 | 44 | 0.089 | 0.083 |
| 11-12 | Everton | 144 | 371 | 51 | 13 | 27 | 0.073 | 0.090 |
| 11-12 | Fulham | 131 | 406 | 45 | 9 | 29 | 0.071 | 0.069 |
| 11-12 | Liverpool | 170 | 491 | 45 | 14 | 24 | 0.049 | 0.082 |
| 11-12 | Manchester City | 156 | 574 | 93 | 19 | 63 | 0.110 | 0.122 |
| 11-12 | Manchester United | 166 | 469 | 89 | 18 | 58 | 0.124 | 0.108 |
| 11-12 | Newcastle United | 137 | 349 | 51 | 8 | 41 | 0.117 | 0.058 |
| 11-12 | Norwich | 143 | 369 | 53 | 16 | 33 | 0.089 | 0.112 |
| 11-12 | Queens Park Rangers | 140 | 396 | 43 | 11 | 26 | 0.066 | 0.079 |
| 11-12 | Stoke | 152 | 218 | 38 | 16 | 12 | 0.055 | 0.105 |
| 11-12 | Sunderland | 112 | 344 | 44 | 10 | 31 | 0.090 | 0.089 |
| 11-12 | Swansea | 113 | 353 | 45 | 7 | 29 | 0.082 | 0.062 |
| 11-12 | Tottenham | 170 | 526 | 66 | 9 | 51 | 0.097 | 0.053 |
| 11-12 | West Bromwich Albion | 142 | 399 | 47 | 15 | 25 | 0.063 | 0.106 |
| 11-12 | Wigan | 113 | 399 | 42 | 11 | 24 | 0.060 | 0.097 |
| 11-12 | Wolverhampton Wanderers | 125 | 344 | 42 | 9 | 26 | 0.076 | 0.072 |
| 12-13 | Arsenal | 119 | 473 | 69 | 12 | 52 | 0.110 | 0.101 |
| 12-13 | Aston Villa | 107 | 328 | 53 | 10 | 28 | 0.085 | 0.093 |
| 12-13 | Chelsea | 148 | 468 | 74 | 15 | 46 | 0.098 | 0.101 |
| 12-13 | Everton | 181 | 450 | 54 | 11 | 39 | 0.087 | 0.061 |
| 12-13 | Fulham | 106 | 348 | 45 | 8 | 31 | 0.089 | 0.075 |
| 12-13 | Liverpool | 170 | 564 | 68 | 11 | 50 | 0.089 | 0.065 |
| 12-13 | Manchester City | 164 | 489 | 66 | 14 | 44 | 0.090 | 0.085 |
| 12-13 | Manchester United | 131 | 422 | 84 | 22 | 50 | 0.118 | 0.168 |
| 12-13 | Newcastle United | 121 | 406 | 45 | 6 | 31 | 0.076 | 0.050 |
| 12-13 | Norwich | 130 | 281 | 43 | 17 | 19 | 0.068 | 0.131 |
| 12-13 | Queens Park Rangers | 131 | 365 | 35 | 5 | 19 | 0.052 | 0.038 |
| 12-13 | Reading | 122 | 267 | 41 | 13 | 24 | 0.090 | 0.107 |
| 12-13 | Southampton | 126 | 387 | 50 | 8 | 29 | 0.075 | 0.063 |
| 12-13 | Stoke | 149 | 236 | 37 | 15 | 11 | 0.047 | 0.101 |
| 12-13 | Sunderland | 128 | 285 | 43 | 11 | 20 | 0.070 | 0.086 |
| 12-13 | Swansea | 95 | 411 | 48 | 5 | 41 | 0.100 | 0.053 |
| 12-13 | Tottenham | 153 | 528 | 63 | 10 | 51 | 0.097 | 0.065 |
| 12-13 | West Bromwich Albion | 116 | 382 | 53 | 9 | 33 | 0.086 | 0.078 |
| 12-13 | West Ham | 163 | 326 | 44 | 12 | 26 | 0.080 | 0.074 |
| 12-13 | Wigan | 131 | 368 | 48 | 13 | 28 | 0.076 | 0.099 |
| 13-14 | Arsenal | 126 | 394 | 70 | 8 | 55 | 0.140 | 0.063 |
| 13-14 | Aston Villa | 83 | 344 | 42 | 7 | 25 | 0.073 | 0.084 |
| 13-14 | Cardiff | 136 | 281 | 30 | 13 | 16 | 0.057 | 0.096 |
| 13-14 | Chelsea | 135 | 550 | 71 | 15 | 47 | 0.085 | 0.111 |
| 13-14 | Crystal Palace | 120 | 288 | 34 | 8 | 17 | 0.059 | 0.067 |
| 13-14 | Everton | 125 | 433 | 62 | 12 | 39 | 0.090 | 0.096 |
| 13-14 | Fulham | 114 | 314 | 42 | 14 | 18 | 0.057 | 0.123 |
| 13-14 | Hull | 134 | 292 | 37 | 10 | 21 | 0.072 | 0.075 |
| 13-14 | Liverpool | 151 | 488 | 102 | 26 | 54 | 0.111 | 0.172 |
| 13-14 | Manchester City | 165 | 501 | 99 | 20 | 69 | 0.138 | 0.121 |
| 13-14 | Manchester United | 128 | 393 | 64 | 11 | 46 | 0.117 | 0.086 |
| 13-14 | Newcastle United | 132 | 444 | 42 | 8 | 30 | 0.068 | 0.061 |
| 13-14 | Norwich | 117 | 348 | 31 | 4 | 20 | 0.057 | 0.034 |
| 13-14 | Southampton | 132 | 399 | 53 | 12 | 36 | 0.090 | 0.091 |
| 13-14 | Stoke | 96 | 327 | 44 | 7 | 31 | 0.095 | 0.073 |
| 13-14 | Sunderland | 144 | 341 | 47 | 13 | 16 | 0.047 | 0.090 |
| 13-14 | Swansea | 99 | 392 | 48 | 10 | 32 | 0.082 | 0.101 |
| 13-14 | Tottenham | 129 | 452 | 53 | 11 | 31 | 0.069 | 0.085 |
| 13-14 | West Bromwich Albion | 136 | 348 | 43 | 6 | 31 | 0.089 | 0.044 |
| 13-14 | West Ham | 129 | 291 | 38 | 10 | 24 | 0.082 | 0.078 |
| 14-15 | Arsenal | 122 | 481 | 70 | 16 | 46 | 0.096 | 0.131 |
| 14-15 | Aston Villa | 119 | 297 | 32 | 10 | 19 | 0.064 | 0.084 |
| 14-15 | Burnley | 115 | 312 | 29 | 7 | 17 | 0.054 | 0.061 |
| 14-15 | Chelsea | 121 | 438 | 73 | 15 | 52 | 0.119 | 0.124 |
| 14-15 | Crystal Palace | 145 | 291 | 46 | 19 | 22 | 0.076 | 0.131 |
| 14-15 | Everton | 116 | 360 | 48 | 11 | 29 | 0.081 | 0.095 |
| 14-15 | Hull | 118 | 310 | 32 | 7 | 24 | 0.077 | 0.059 |
| 14-15 | Leicester | 130 | 323 | 50 | 12 | 25 | 0.077 | 0.092 |
| 14-15 | Liverpool | 123 | 461 | 50 | 6 | 35 | 0.076 | 0.049 |
| 14-15 | Manchester City | 136 | 526 | 85 | 12 | 60 | 0.114 | 0.088 |
| 14-15 | Manchester United | 121 | 387 | 61 | 12 | 44 | 0.114 | 0.099 |
| 14-15 | Newcastle United | 144 | 323 | 41 | 7 | 31 | 0.096 | 0.049 |
| 14-15 | Queens Park Rangers | 163 | 367 | 43 | 12 | 20 | 0.054 | 0.074 |
| 14-15 | Southampton | 126 | 381 | 49 | 6 | 41 | 0.108 | 0.048 |
| 14-15 | Stoke | 134 | 365 | 47 | 6 | 38 | 0.104 | 0.045 |
| 14-15 | Sunderland | 121 | 283 | 35 | 9 | 12 | 0.042 | 0.074 |
| 14-15 | Swansea | 103 | 321 | 44 | 4 | 36 | 0.112 | 0.039 |
| 14-15 | Tottenham | 132 | 390 | 58 | 15 | 36 | 0.092 | 0.114 |
| 14-15 | West Bromwich Albion | 118 | 288 | 37 | 19 | 14 | 0.049 | 0.161 |
| 14-15 | West Ham | 156 | 331 | 45 | 12 | 28 | 0.085 | 0.077 |
| 15-16 | Arsenal | 129 | 441 | 65 | 13 | 45 | 0.102 | 0.101 |
| 15-16 | Aston Villa | 109 | 269 | 28 | 7 | 11 | 0.041 | 0.064 |
| 15-16 | Bournemouth | 122 | 338 | 43 | 12 | 28 | 0.083 | 0.098 |
| 15-16 | Chelsea | 118 | 403 | 57 | 11 | 38 | 0.094 | 0.093 |
| 15-16 | Crystal Palace | 157 | 307 | 42 | 15 | 15 | 0.049 | 0.096 |
| 15-16 | Everton | 119 | 367 | 57 | 8 | 43 | 0.117 | 0.067 |
| 15-16 | Leicester | 147 | 362 | 67 | 11 | 46 | 0.127 | 0.075 |
| 15-16 | Liverpool | 142 | 485 | 63 | 15 | 44 | 0.091 | 0.106 |
| 15-16 | Manchester City | 167 | 440 | 72 | 14 | 51 | 0.116 | 0.084 |
| 15-16 | Manchester United | 114 | 313 | 48 | 7 | 34 | 0.109 | 0.061 |
| 15-16 | Newcastle United | 77 | 317 | 45 | 8 | 30 | 0.095 | 0.104 |
| 15-16 | Norwich | 115 | 302 | 40 | 10 | 25 | 0.083 | 0.087 |
| 15-16 | Southampton | 127 | 388 | 57 | 13 | 41 | 0.106 | 0.102 |
| 15-16 | Stoke | 96 | 317 | 40 | 6 | 29 | 0.091 | 0.063 |
| 15-16 | Sunderland | 128 | 308 | 45 | 15 | 25 | 0.081 | 0.117 |
| 15-16 | Swansea | 115 | 321 | 46 | 8 | 23 | 0.072 | 0.070 |
| 15-16 | Tottenham | 150 | 503 | 71 | 17 | 43 | 0.085 | 0.113 |
| 15-16 | Watford | 110 | 329 | 39 | 8 | 21 | 0.064 | 0.073 |
| 15-16 | West Bromwich Albion | 118 | 266 | 35 | 12 | 16 | 0.060 | 0.102 |
| 15-16 | West Ham | 171 | 383 | 66 | 16 | 42 | 0.110 | 0.094 |
| Average | 142.7 | 375.8 | 52.1 | 12.1 | 32.2 | 0.086 | 0.085 |


