Twitter

Showing posts with label Shots on Target. Show all posts

Monday, 6 July 2015

Explaining Goals - How much does shot quality, location and distance actually add?

As the shot quality argument rages on in football, I have been running numbers to see what all the fuss is about. Expected Goal (xG) believers and skeptics have been back and forth on the topic for ages.

I will admit that I am skeptical of the degree to which shot location, distance and quality impact goals. Admittedly, much of this doubt comes from the work done in hockey but also James Grayson and Ben Pugsley contributed to my lack of 'buy in'.

Even with this doubt, I thought that given the popularity of xG's it would better explain Goals For/Against compared to raw shot metrics.

I would like to thank Michael Caley* and Paul Riley** for making their xG results public. This piece is not directed at them or anyone else in particular. I was curious and it just happens that they do not hide behind a curtain of secrecy, which I really respect.


Explaining Goals For

Testing Errors

2014-15 EPL 
For a description of the work I did please go to the bottom of the page. 


When looking at the errors, the lower the number the better.
Shots on Target seems to be the forgotten/ignored metric in the shot quality argument. Without the influence of location they fared much better than the 2 xG's models.

Danger Zone Shots are the elephant in the room. They did a worse job than Total Shots For in explaining goals this past season.

For the 2014-15 season, we see little evidence that location made a significant impact. Total Shots > SiB > Danger Zone.


We Need More Data


Now I know you are thinking that this is only one season of one league. I tried to find past season xG's results for both Caley and Riley's (or any) models but was unable to find it on the web to test more seasons of the EPL (If you care to share, I would love to test the results).

I did find xG data from Michael Caley's site for the 2013-14 Bundesliga, La Liga and Serie A seasons.

Here are the results from the continent:


Bundesliga 2013-14


In Germany, we see that location has little impact on Goals For. Shots on Target come out the best. 


La Liga 2013-14


Shots on Target continue the trend of being the best predictor of Goals For.  Location? Not adding a lot. 


Serie A 2013-14


And finally in Italia we see that SoT leads the way.  Again, Location not really doing what I had expected.


What are xGF Measuring?


I ran the r^2 of xGF vs all the raw shot metrics to look for correlation and these were the best matches:

EPL:
Riley xGF vs Shots on Target For: .92
Caley xGF vs Shots Inside the Box For: .87

Bundesliga:
Caley xGF vs Shots Inside the Box For: .95

La Liga:
Caley xGF vs Shots Inside the Box For: .94

Serie A:
Caley xGF vs Shots Inside the Box For: .88

We see that Caley's model heavily measures Shots Inside the Box, whilst Riley's model closely resembles Shots on Target (As I understand it his model is mostly based on Shots on Target)

Those are strong relationships to basic shots counts.


Goals For: Does Location Matter?


From what I can tell there is not a lot that location adds to the story of explaining Goals For.

Most intriguing here is that Danger Zone Shots are less reliable than counting all Shots inside the Box in every league. 

Shot quality may exist in attack but its impact is negligible given all the factors that go into scoring a goal.

The lack of publicly available data to properly test the various models is the most frustrating thing. The secrecy and proprietary element of xG's is a hindrance to moving forward. Again, it is a breath of fresh air that Paul and Michael release their results (even if their formulas and algorithms remain a secret).


Explaining Goals Against

Testing Errors

2014-15 EPL


First thing to point out is that Goals Against are tougher to explain as shown by the lower r^2 values.

We see here that Caley's model does a better job on the defensive side of things. Shots on Target and Shots inside the Box trail only slightly in explaining Goals Against. 

Given all the different factors that go into a goal against, are these marginal gains reason to claim location or quality of shot is significant?

Total Shots, Danger Zone and Shots inside the Box are all pretty close based on the errors.  Again it’s tough to call the differences significant but Shots inside the Box just edge Danger Zone Shots in terms of explanatory power.

Here are the results from the continent:


Bundesliga 2013-14


All metrics are in close proximity based on errors. Shots on Target with the marginal edge.


La Liga 2013-14


In Spain, things are close again with Caley xGA edging out Shots on Target. 


Serie A 2013-14


Finally, in Serie A, it is to close to call.


What are xGA Measuring?


I ran the r^2 of xGA's vs all the raw shot metrics to look for correlation and these are what I found were the best matches:

EPL:
Riley xGA vs Shots on Target Ag: .89
Caley xGA vs Danger Zone Shots Ag: .88

Bundesliga:
Caley xGA vs Shots Inside the Box Ag: .95

La Liga:
Caley xGA vs Shots Inside the Box Ag: .95

Serie A:
Caley xGA vs Shots Inside the Box Ag: .94

Again, we see strong links to other non-complex shots counts.


Goals Against: Does Location Matter?


As with Goals For, I am struggling to differentiate shot quality from non-shot quality based metrics based on the errors.  xGA did a better job than their xGF counterparts but we only see slight differences in the explanatory power vs non-specific location based metrics.


Conclusion


Despite my initial skepticism, I came into this wondering 'how far ahead are xG's models?'  Given their widespread acceptance, I assumed that it would be obvious that adjusting for location/quality makes a significant difference.

Instead, the numbers show that shot distance/location/quality is just a tiny portion of shooting (both for and against). The added complexity seems to be unnecessary, at least in explaining goals. It tends to not add anything significant compared to non-location based metrics, specifically Shots on Target.

I have often seen analysis comparing xG to TSR, I think I have shown it’s more valuable to start comparing xG's to Shots on Target instead of Total Shots.

Danger Zone Shots need more rigorous testing too. Repeatability and predictability tests needs to be done so we can determine if this is more than a fancy name. Maybe that is harsh but I am not impressed with how they performed vs. how they are presented in the public domain.

I get that this will not be a popular post but I hope it creates a conversation and leads to more rigorous public testing of xG's models as well as the inputs that go into these models.  I guess in the end I want more transparency. The point of analytics are to find truths and debunk myths. The results are important to moving the conversation forward.
 
Lastly, I remain a skeptic on shot quality. I do believe it is in there somewhere but more work needs to be done.

Cheers,

Clarke
@footyinthecloud


*Michael Caley's data and methodology can be found here and he is on twitter: @MC_of_A

**Paul Riley's blog and methodology is found here and he is also on twitter: @footballfactman


Explanation

What I have done is use the shot data for the various leagues from Michael Caley's* site to find slope equations for Shots For, Shots on Target For, Shots Inside the Box For, Danger Zone Shots For vs. Actual Goals For and then compared the results to both Caley* & Riley** xGF.  I ran a bunch of error tests to help us see more than just the r^2.


For example here is Goals For vs Total Shots For:


We take the slope equation and plug the actual Total Shots For into x and this gives us our 'xGF based on Total Shots For' for the 2014-15 season.

We do this for each shot metric and compare to Caley and Riley xG model's by testing the errors of each metric in explaining Goals For.  If you want to know the meaning of the errors, I would suggest google :)


Tuesday, 21 April 2015

14-15 EPL 11v11 Shot Metric Table


Team Mins TSR% SoTR Sh% Sv% PDO
Arsenal 2813 59.0% 62.2% 33.7% 72.2% 105.9%
Aston Villa 2798 45.1% 42.2% 24.5% 69.4% 93.9%
Burnley 2891 43.0% 40.8% 23.1% 67.5% 90.7%
Chelsea 2681 57.2% 63.3% 35.9% 77.3% 113.2%
Crystal Palace 2896 47.3% 50.0% 35.0% 65.0% 100.0%
Everton 2870 47.7% 54.7% 29.6% 62.5% 92.1%
Hull 2633 45.4% 46.2% 26.5% 67.2% 93.7%
Leicester 2815 42.9% 41.1% 30.6% 68.6% 99.2%
Liverpool 2798 58.4% 59.0% 27.8% 69.1% 96.9%
Man City 2768 63.5% 62.7% 34.7% 67.3% 102.0%
Man United 2785 57.3% 56.6% 37.9% 74.8% 112.7%
Newcastle 2918 50.6% 47.2% 28.8% 60.6% 89.4%
QPR 2851 47.0% 41.6% 27.8% 68.4% 96.1%
Southampton 2871 56.2% 61.3% 31.2% 75.3% 106.5%
Stoke 2876 51.7% 45.5% 36.0% 66.7% 102.7%
Sunderland 2761 39.9% 38.4% 24.5% 70.7% 95.2%
Swansea 2829 45.0% 45.3% 29.0% 73.3% 102.4%
Tottenham 2842 51.8% 50.3% 32.5% 69.1% 101.6%
West Brom 2747 47.7% 45.6% 28.4% 67.7% 96.1%
West Ham 2818 44.5% 45.4% 31.3% 72.7% 104.0%

Wednesday, 18 March 2015

Friday, 13 March 2015

Macro look at combined Attack/Defense in the Premier League

As we come down the stretch, I wanted to take a quick look at the shots and goals numbers for & against. Lots of times we only see the Shot Ratios (i.e. TSR, SoTR, GF%) posted but they do not give us the actual quantity of shots each team has taken and given up.

I know scatter plots can be tough to read/decipher but, for me, this is the best way to show where teams stand.

*This is the 3rd post of 3. The 1st post covered Attack and the 2nd looked at the Defense


Attack & Defense Combined

Shots on Target Differential vs Total Shots Differential


We can see that their is a clear top 5 teams with Man United lagging behind. The race for the 3rd and 4th Champions League spots looks like they could come down to the last game of the season.  Extremely tight.

Meanwhile, Sunderland are just abysmal. How they are not sitting at the bottom table is fascinating.

Everton, stand out as outliers, along with Chelsea, in over performance of shots on target. Chelsea are thriving off this, while Everton haven't been able to capitalize.


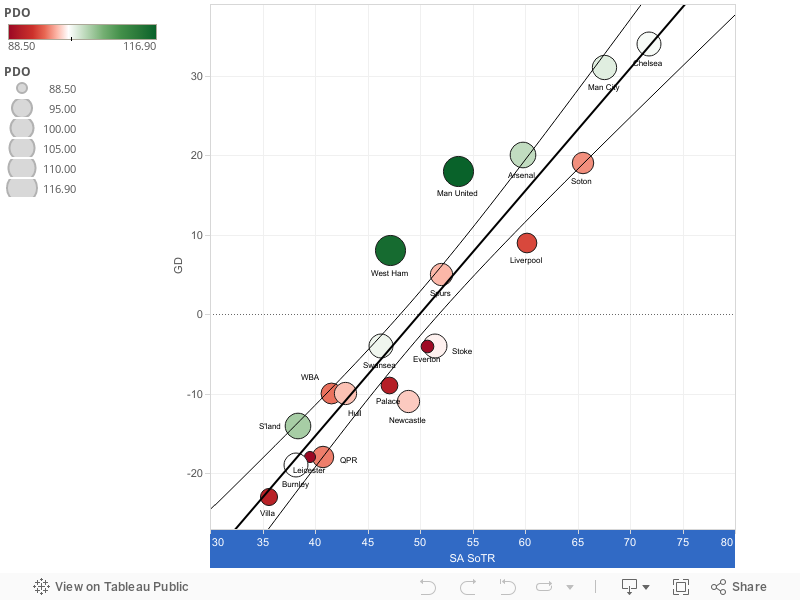
Goal Differential vs Shots on Target Differential


*If you are not familiar with PDO please check out the Glossary along the top of the page.


Analytics tell us to expect Man United's PDO to regress toward the mean (100). Many, mistakenly, think that if a team carries a very high PDO for a lengthy period of time that it will, in turn, have a game or multiple games where the team has a terribly low PDO. This is gamblers fallacy which many confuse with regression to the mean. 38 games is a small sample and good/bad fortune can last over the course of the season (or even more), even if it is unlikely. For example, Man City finished last season with ~112.0 PDO.

**Just for clarification, I am not saying Man United's PDO will stay high (It could fall off a cliff, for all I know). I am just trying to clarify that over the last 10 games (for all teams) anything can happen. The previous 28 games do not determine the PDO of game 29. Much like flipping a coin and getting heads 10 times in a row doesn't mean the odds of getting tails is higher on the 11th flip**


That is the end of this short 'series' of blogs. Hopefully, you found it somewhat informative and/or made you think about things a little different.

Cheers,

Clarke


Wednesday, 11 March 2015

Macro look at the 'Defenses' in the Premier League

As we come down the stretch, I wanted to take a quick look at the shots and goals numbers for & against. Lots of times we only see the Shot Ratios (i.e. TSR, SoTR, GF%) posted but they do not give us the actual quantity of shots each team has taken and given up.

I know scatter plots can be tough to read/decipher but, for me, this is the best way to show where teams stand.

*This is the 2nd post of 3 (time permitting). The 1st post covered Attack, this one will focus on Defense and the last one will combine Attack/Defense by looking at Shot/Goal Difference.

Defense

Shots on Target Against vs Total Shots Against


Southampton! Least amount of 'shots against' and 'shots on target against'. The defensive side of the ball is why they have such high TSR and SoTR's. What they have done, defensively, is both sustainable and amazing. Soton's 'money spent vs. performance' compared to the two oil-financed clubs is very 'Oakland Athletics' like.

Manchester United and Spurs are giving up far to many shots on target. United do a good job of suppressing shots but when they do get through they seem to be hitting the target (and as we will see below, hitting De Gea). Spurs on the other hand have been quite easy to play against giving up a lot of shots coupled with a high rate on target.  

In the attacking piece I didn't mention Everton because their was nothing 'out of the ordinary' with their numbers. Now, defensively, they are having an interesting season. Martinez has been heavily scrutinized for how he sets up his team and that is fair given that they sit 12th in total shots against.
They have a lot fewer 'shots on target against' than would be expected and normally this would be a good thing, even if it is a bit fortunate, but this has not led to success. We look below as to why?


Goals Against vs Shots on Target Against


Goalkeepers are voodoo. Ask Everton. Pretty much, all of Everton's under performance in the league is down to their inability to stop the ball.  They sit dead last in save % (table below), while last season they were 2nd. Everton have been both, slightly lucky (6th lowest shots on target) and really unlucky (league low save %) this season. Both these metrics should regress but it is too late for it to matter, this season. 

On the opposite end of the voodoo spectrum, we have Man United, who are getting away with it, this season. 8th in shots on target against and De Gea bailing them out. This United team are riding the variance of their goalkeeper. Will it last? Crazier things have happened.

Another notable outlier is Sunderland. Pantillimon, since coming in to the side, has been the saviour. His performance is the reason they are not buried in the relegation places.


Here is the save% of each team (sortable).
Team Save %
Arsenal 70.0
Aston Villa 69.1
Burnley 66.9
Chelsea 72.8
Crystal Palace 64.2
Everton 59.0
Hull 68.1
Leicester 65.4
Liverpool 68.4
Man City 69.0
Man United 75.9
Newcastle 61.6
QPR 69.2
Southampton 73.7
Stoke 64.6
Sunderland 73.8
Swansea 72.6
Tottenham 70.5
West Brom 69.5
West Ham 74.2
Average 69.0
* compiled using footstats.co.uk

Clarke 


Tuesday, 10 March 2015

Macro look at the 'Attacks' in the Premier League

As we come down the stretch, I wanted to take a quick look at the shots and goals numbers for & against. Lots of times we only see the Shot Ratios (i.e. TSR, SoTR, GF%) posted but they do not give us the actual quantity of shots each team has taken and given up.

I know scatter plots can be tough to read/decipher but, for me, this is the best way to show where teams stand.

*This is the 1st post of 3 (time permitting). This one will focus on Attack. The next will be Defense, followed by combining Attack/Defense and looking at Shot/Goal Difference.


Attack

Shots on Target For vs Total Shots For

Who had QPR leading Man United in 'total shots for' before the season started? Problem for QPR is that they just do not hit the target. Some of this will be down to poor shot selection and some down to being unlucky but I think we can make a guess that QPR (and Stoke) start hitting the target at a more normal rate over the last 10 matches.

Chelsea continue to lead in 'shots on target' but Man City has made gains in recent weeks. I have been expecting Chelsea to regress to a normal rate of putting shots on net but this has not happened. Their ability to get into dangerous shooting areas has been very good. As per Objective Football, Chelsea leads the league in 'minutes played while leading' by a lot of minutes and this is probably driving the disparity between shots and shots on target.

Man United and Southampton really do not have 'Top 4' shot numbers. Meanwhile Spurs seem to be moving on up in the shots for department.


Goals For vs Shots on Target For


Liverpool really should have more goals, at this point, based on their shots on target. Kind of surprising given their solid run of form over last couple months. I cannot really see any reason why the goals will dry up, other than injuries.

Aston Villa cannot score goals this season (~18% G/SoT). Can 'Tactics Tim' simply say 'Benteke, score me some goals'? Worked for Mr. Burns on the Simpsons Episode 'Homer at the Bat' (Could not, for the life of me, find a video clip):

Burns: You, Strawberry, hit a home run.
Strawberry: Okay, skip.
(hits a home run)
Burns: Ha-ha! I told him to do that.
Smithers: Brilliant strategy sir.

If Villa start scoring it will be more to do with regression rather than Sherwood waving his magic wand. I am sure the media will see it this way, as well.

I mentioned, above, that we could make a guess that Stoke will start hitting the target more often. We can also make an assumption that they will score at a slower rate. Now this does not mean they will not score. It just means that they will score at more normal rate. Essentially, the increase in shots on target will offset the decline in scoring %. Confused? Me too.

Man, stats can be Hard to Expain...


Clarke

Tuesday, 24 February 2015

Thursday, 19 February 2015

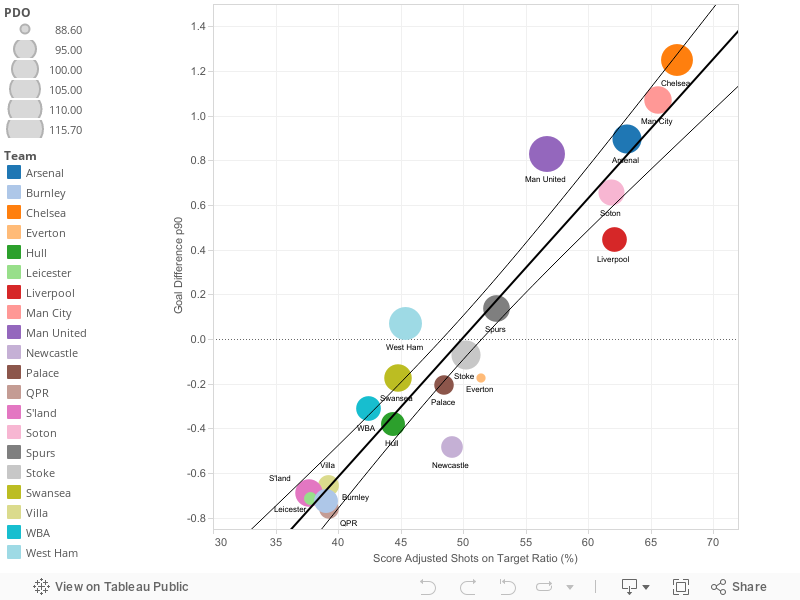
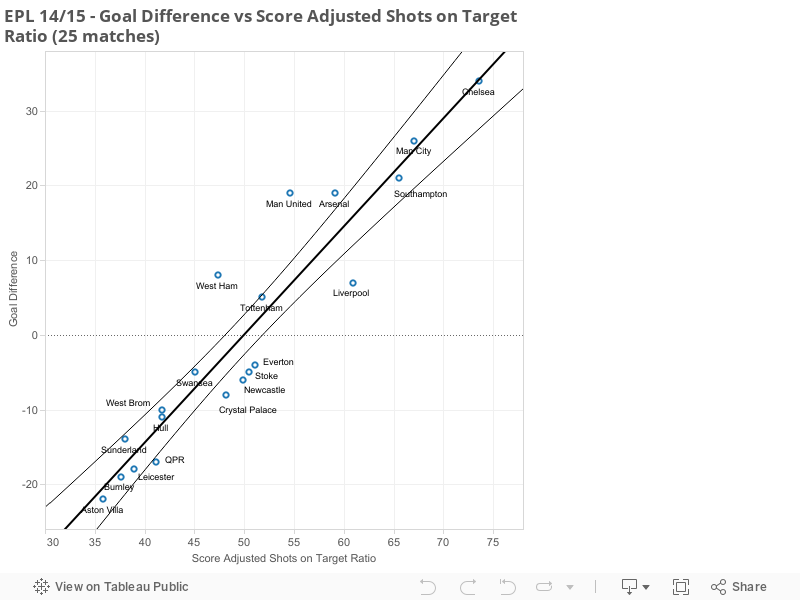
Goals Difference vs Score Adjusted Shots on Target Ratio

I have taken @objectivefooty 's tracking of Score Adjusted Shots on Target Ratio in the Premier League to date (25gms) and compared to Goal Difference. http://objective-football.blogspot.com.es/2014/10/201415-score-adjusted-numbers.html

Would you rather be Man United or Liverpool going into the last 13 matches?

R-squared of .887

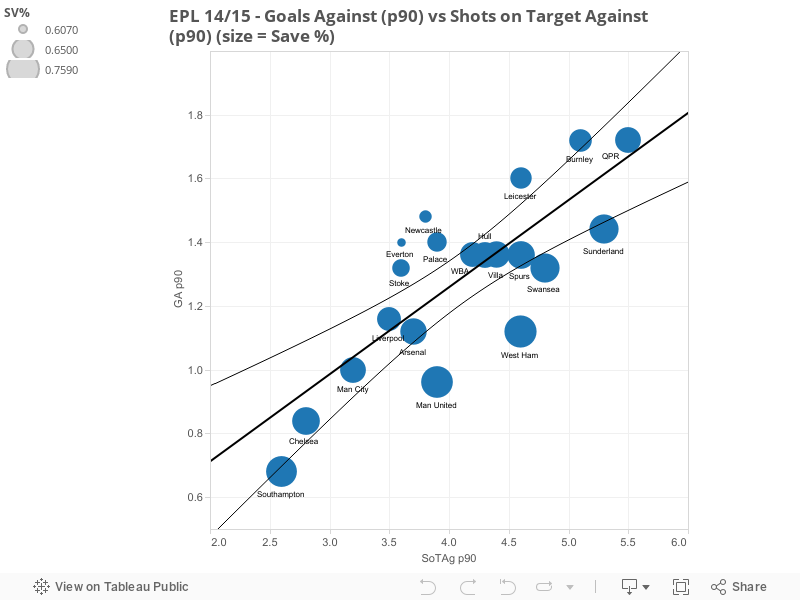
Goals Against vs. Shots on Target Against (25 games)

Here is a viz created using Tableau:

Man United and West Ham are crazy outliers with very high save%'s keeping their seasons from being much worse.

On the other side, we have Everton and Newcastle who are serious outliers with poor save %'s. For Everton, they could very easily be up around 6th position with a league average save %.

Expect these 4 teams to all  regress towards the league average save % of approximately 68%.