As the shot quality argument rages on in
football, I have been running numbers to see what all the fuss is about.
Expected Goal (xG) believers and skeptics have been back and forth on the topic
for ages.
I will admit that I am skeptical of the degree to which shot location, distance and quality impact goals. Admittedly, much of this doubt comes from the work done in hockey but also James Grayson and Ben Pugsley contributed to my lack of 'buy in'.
Even with this doubt, I thought that given
the popularity of xG's it would better explain Goals For/Against compared to raw shot metrics.
I would like to thank Michael Caley* and
Paul Riley** for making their xG results public. This piece is not directed at
them or anyone else in particular. I was curious and it just happens that they
do not hide behind a curtain of secrecy, which I really respect.
Explaining Goals For
Testing Errors
2014-15 EPL
For a description of the work I did please go to the bottom of the page.
 |
| When looking at the errors, the lower the number the better. |
Danger Zone Shots are the elephant in the room. They did a worse job than Total Shots For in explaining goals this past season.
For the 2014-15 season, we see little
evidence that location made a significant impact. Total Shots > SiB >
Danger Zone.
We Need More Data
Now I know you are thinking that this is
only one season of one league. I tried to find past season xG's results for both
Caley and Riley's (or any) models but was unable to find it on the web to test
more seasons of the EPL (If you care to share, I would love to test the
results).
I did find xG data from Michael Caley's site for the 2013-14 Bundesliga, La Liga and Serie A seasons.
Here are the results from the continent:
Bundesliga 2013-14

In Germany, we see that location has little impact on Goals For. Shots on Target come out the best.
La Liga 2013-14

Shots on Target continue the trend of being the best predictor of Goals For. Location? Not adding a lot.
Serie A 2013-14

And finally in Italia we see that SoT leads the way. Again, Location not really doing what I had expected.
What are xGF Measuring?
I ran the
r^2 of xGF vs all the raw shot metrics to look for correlation and these were
the best matches:
EPL:
Riley
xGF vs Shots on Target For: .92
Caley
xGF vs Shots Inside the Box For: .87
Bundesliga:
Caley
xGF vs Shots Inside the Box For: .95
La
Liga:
Caley
xGF vs Shots Inside the Box For: .94
Serie
A:
Caley
xGF vs Shots Inside the Box For: .88
We see
that Caley's model heavily measures Shots Inside the Box, whilst Riley's model
closely resembles Shots on Target (As I understand it his model is mostly based
on Shots on Target)
Those
are strong relationships to basic shots counts.
Goals For: Does Location Matter?
From
what I can tell there is not a lot that location adds to the story of explaining
Goals For.
Most
intriguing here is that Danger Zone Shots are less reliable than counting all
Shots inside the Box in every league.
Shot
quality may exist in attack but its impact is negligible given all the factors
that go into scoring a goal.
The
lack of publicly available data to properly test the various models is the most
frustrating thing. The secrecy and proprietary element of xG's is a hindrance to
moving forward. Again, it is a breath of fresh air that Paul and Michael release
their results (even if their formulas and algorithms remain a secret).
Explaining Goals Against
Testing Errors
2014-15 EPL

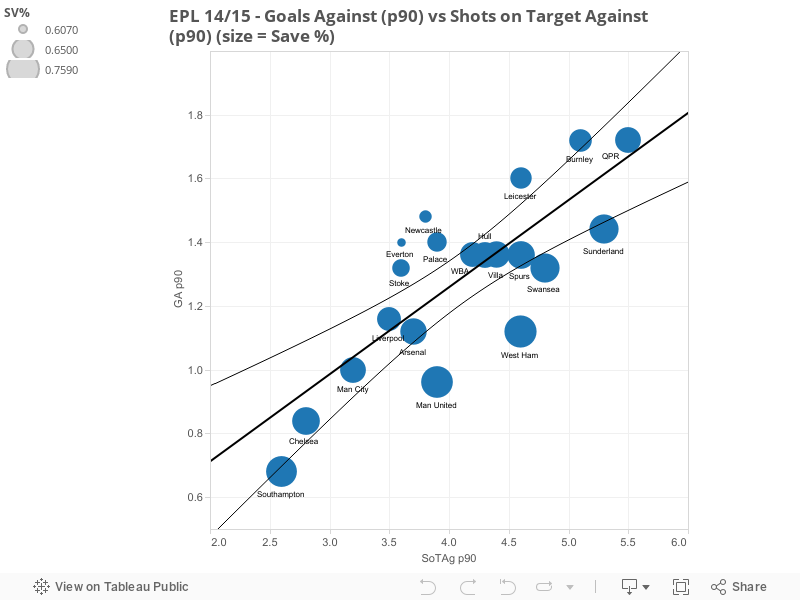
First thing to point out is that Goals Against are tougher to explain as shown by the lower r^2
values.
We see
here that Caley's model does a better job on the defensive side of things. Shots
on Target and Shots inside the Box trail only slightly in explaining Goals
Against.
Given
all the different factors that go into a goal against, are these marginal gains reason to
claim location or quality of shot is significant?
Total
Shots, Danger Zone and Shots inside the Box are all pretty close based on the
errors. Again it’s tough to call the differences significant but Shots
inside the Box just edge Danger Zone Shots in terms of explanatory power.
Here are the results from the continent:
Bundesliga 2013-14

All metrics are in close proximity based on errors. Shots on Target with the marginal edge.

La Liga 2013-14


In Spain, things are close again with Caley xGA edging out Shots on Target.
Serie A 2013-14

Finally, in Serie A, it is to close to call.
What are xGA Measuring?
I ran
the r^2 of xGA's vs all the raw shot metrics to look for correlation and these
are what I found were the best matches:
EPL:
Riley
xGA vs Shots on Target Ag: .89
Caley
xGA vs Danger Zone Shots Ag: .88
Bundesliga:
Caley
xGA vs Shots Inside the Box Ag: .95
La
Liga:
Caley
xGA vs Shots Inside the Box Ag: .95
Serie
A:
Caley
xGA vs Shots Inside the Box Ag: .94
Again,
we see strong links to other non-complex shots counts.
Goals Against: Does Location Matter?
As with Goals For, I am struggling to differentiate shot quality from non-shot quality based metrics based on the errors. xGA did a better job than their xGF counterparts but we only see slight differences in the explanatory power vs non-specific location based metrics.
Conclusion
Despite my initial skepticism, I came
into this wondering 'how far ahead are xG's models?' Given their
widespread acceptance, I assumed that it would be obvious that adjusting for
location/quality makes a significant difference.
Instead, the numbers show that
shot distance/location/quality is just a tiny portion of shooting (both for and
against). The added complexity seems to be unnecessary, at least in explaining
goals. It tends to not add anything significant compared to non-location based
metrics, specifically Shots on Target.
I have often seen analysis comparing xG to
TSR, I think I have shown it’s more valuable to start comparing xG's
to Shots on Target instead of Total
Shots.
Danger Zone Shots need more rigorous testing too.
Repeatability and predictability tests needs to be done so we can determine if
this is more than a fancy name. Maybe that is harsh but I am not impressed with
how they performed vs. how they are presented in the public
domain.
I get that this will not be a popular post but I hope it creates a conversation and leads to more rigorous public testing of xG's models as well as the inputs that go into these models. I guess in the end I want more transparency. The point of analytics are to find truths and debunk myths. The results are important to moving the conversation forward.
Lastly, I remain a skeptic on shot quality. I do believe it is in there somewhere but more work needs to be done.
Cheers,
Clarke
@footyinthecloud
@footyinthecloud
*Michael Caley's data and methodology can be found here and he is on twitter: @MC_of_A
**Paul Riley's blog and methodology is found here and he is also on twitter: @footballfactman
Explanation
What I have done is use the shot data for the various leagues from Michael Caley's* site to find slope equations for Shots For, Shots on Target For, Shots Inside the Box For, Danger Zone Shots For vs. Actual Goals For and then compared the results to both Caley* & Riley** xGF. I ran a bunch of error tests to help us see more than just the r^2.
For example here is Goals For vs Total Shots For:

We take the slope equation and plug the actual Total Shots For into x and this gives us our 'xGF based on Total Shots For' for the 2014-15 season.
We do this for each shot metric and compare to Caley and Riley xG model's by testing the errors of each metric in explaining Goals For. If you want to know the meaning of the errors, I would suggest google :)