| Team | Mins | TSR% | SoTR | Sh% | Sv% | PDO |
|---|---|---|---|---|---|---|
| Arsenal | 2813 | 59.0% | 62.2% | 33.7% | 72.2% | 105.9% |
| Aston Villa | 2798 | 45.1% | 42.2% | 24.5% | 69.4% | 93.9% |
| Burnley | 2891 | 43.0% | 40.8% | 23.1% | 67.5% | 90.7% |
| Chelsea | 2681 | 57.2% | 63.3% | 35.9% | 77.3% | 113.2% |
| Crystal Palace | 2896 | 47.3% | 50.0% | 35.0% | 65.0% | 100.0% |
| Everton | 2870 | 47.7% | 54.7% | 29.6% | 62.5% | 92.1% |
| Hull | 2633 | 45.4% | 46.2% | 26.5% | 67.2% | 93.7% |
| Leicester | 2815 | 42.9% | 41.1% | 30.6% | 68.6% | 99.2% |
| Liverpool | 2798 | 58.4% | 59.0% | 27.8% | 69.1% | 96.9% |
| Man City | 2768 | 63.5% | 62.7% | 34.7% | 67.3% | 102.0% |
| Man United | 2785 | 57.3% | 56.6% | 37.9% | 74.8% | 112.7% |
| Newcastle | 2918 | 50.6% | 47.2% | 28.8% | 60.6% | 89.4% |
| QPR | 2851 | 47.0% | 41.6% | 27.8% | 68.4% | 96.1% |
| Southampton | 2871 | 56.2% | 61.3% | 31.2% | 75.3% | 106.5% |
| Stoke | 2876 | 51.7% | 45.5% | 36.0% | 66.7% | 102.7% |
| Sunderland | 2761 | 39.9% | 38.4% | 24.5% | 70.7% | 95.2% |
| Swansea | 2829 | 45.0% | 45.3% | 29.0% | 73.3% | 102.4% |
| Tottenham | 2842 | 51.8% | 50.3% | 32.5% | 69.1% | 101.6% |
| West Brom | 2747 | 47.7% | 45.6% | 28.4% | 67.7% | 96.1% |
| West Ham | 2818 | 44.5% | 45.4% | 31.3% | 72.7% | 104.0% |
Showing posts with label save %. Show all posts
Showing posts with label save %. Show all posts
Tuesday, 21 April 2015
14-15 EPL 11v11 Shot Metric Table
Friday, 13 March 2015
Macro look at combined Attack/Defense in the Premier League
As we come down the stretch, I wanted to take a quick look at the
shots and goals numbers for & against. Lots of times we only see
the Shot Ratios (i.e. TSR, SoTR, GF%) posted but they do not give us
the actual quantity of shots each team has taken and given up.
I know scatter plots can be tough to read/decipher but, for me, this is the best way to show where teams stand.
*This is the 3rd post of 3. The 1st post covered Attack and the 2nd looked at the Defense.

We can see that their is a clear top 5 teams with Man United lagging behind. The race for the 3rd and 4th Champions League spots looks like they could come down to the last game of the season. Extremely tight.
Meanwhile, Sunderland are just abysmal. How they are not sitting at the bottom table is fascinating.
Everton, stand out as outliers, along with Chelsea, in over performance of shots on target. Chelsea are thriving off this, while Everton haven't been able to capitalize.

*If you are not familiar with PDO please check out the Glossary along the top of the page.
Analytics tell us to expect Man United's PDO to regress toward the mean (100). Many, mistakenly, think that if a team carries a very high PDO for a lengthy period of time that it will, in turn, have a game or multiple games where the team has a terribly low PDO. This is gamblers fallacy which many confuse with regression to the mean. 38 games is a small sample and good/bad fortune can last over the course of the season (or even more), even if it is unlikely. For example, Man City finished last season with ~112.0 PDO.
**Just for clarification, I am not saying Man United's PDO will stay high (It could fall off a cliff, for all I know). I am just trying to clarify that over the last 10 games (for all teams) anything can happen. The previous 28 games do not determine the PDO of game 29. Much like flipping a coin and getting heads 10 times in a row doesn't mean the odds of getting tails is higher on the 11th flip**
That is the end of this short 'series' of blogs. Hopefully, you found it somewhat informative and/or made you think about things a little different.
Cheers,
Clarke
Follow @footyinthecloud
I know scatter plots can be tough to read/decipher but, for me, this is the best way to show where teams stand.
*This is the 3rd post of 3. The 1st post covered Attack and the 2nd looked at the Defense.
Attack & Defense Combined
Shots on Target Differential vs Total Shots Differential
We can see that their is a clear top 5 teams with Man United lagging behind. The race for the 3rd and 4th Champions League spots looks like they could come down to the last game of the season. Extremely tight.
Meanwhile, Sunderland are just abysmal. How they are not sitting at the bottom table is fascinating.
Everton, stand out as outliers, along with Chelsea, in over performance of shots on target. Chelsea are thriving off this, while Everton haven't been able to capitalize.
Goal Differential vs Shots on Target Differential
*If you are not familiar with PDO please check out the Glossary along the top of the page.
Analytics tell us to expect Man United's PDO to regress toward the mean (100). Many, mistakenly, think that if a team carries a very high PDO for a lengthy period of time that it will, in turn, have a game or multiple games where the team has a terribly low PDO. This is gamblers fallacy which many confuse with regression to the mean. 38 games is a small sample and good/bad fortune can last over the course of the season (or even more), even if it is unlikely. For example, Man City finished last season with ~112.0 PDO.
**Just for clarification, I am not saying Man United's PDO will stay high (It could fall off a cliff, for all I know). I am just trying to clarify that over the last 10 games (for all teams) anything can happen. The previous 28 games do not determine the PDO of game 29. Much like flipping a coin and getting heads 10 times in a row doesn't mean the odds of getting tails is higher on the 11th flip**
That is the end of this short 'series' of blogs. Hopefully, you found it somewhat informative and/or made you think about things a little different.
Cheers,
Clarke
Follow @footyinthecloud
Wednesday, 11 March 2015
Macro look at the 'Defenses' in the Premier League
As we come down the stretch, I wanted to take a quick look at the
shots and goals numbers for & against. Lots of times we only see
the Shot Ratios (i.e. TSR, SoTR, GF%) posted but they do not give us
the actual quantity of shots each team has taken and given up.
I know scatter plots can be tough to read/decipher but, for me, this is the best way to show where teams stand.
*This is the 2nd post of 3 (time permitting). The 1st post covered Attack, this one will focus on Defense and the last one will combine Attack/Defense by looking at Shot/Goal Difference.
Defense
Shots on Target Against vs Total Shots Against


Goalkeepers are voodoo. Ask Everton. Pretty much, all of Everton's under performance in the league is down to their inability to stop the ball. They sit dead last in save % (table below), while last season they were 2nd. Everton have been both, slightly lucky (6th lowest shots on target) and really unlucky (league low save %) this season. Both these metrics should regress but it is too late for it to matter, this season.
Here is the save% of each team (sortable).
Follow @footyinthecloud
Southampton! Least amount of 'shots against' and 'shots on target against'. The defensive side of the ball is why they have such high TSR and SoTR's. What they have done, defensively, is both sustainable and amazing. Soton's 'money spent vs. performance' compared to the two oil-financed clubs is very 'Oakland Athletics' like.
Manchester United and Spurs are giving up far to many shots on target. United do a good job of suppressing shots but when they do get through they seem to be hitting the target (and as we will see below, hitting De Gea). Spurs on the other hand have been quite easy to play against giving up a lot of shots coupled with a high rate on target.
In the attacking piece I didn't mention Everton because their was nothing 'out of the ordinary' with their numbers. Now, defensively, they are having an interesting season. Martinez has been heavily scrutinized for how he sets up his team and
that is fair given that they sit 12th in total shots against.
They have a lot fewer 'shots on target against' than would be expected and normally this would be a good thing, even if it is a bit fortunate, but this has not led to success. We look below as to why?
They have a lot fewer 'shots on target against' than would be expected and normally this would be a good thing, even if it is a bit fortunate, but this has not led to success. We look below as to why?
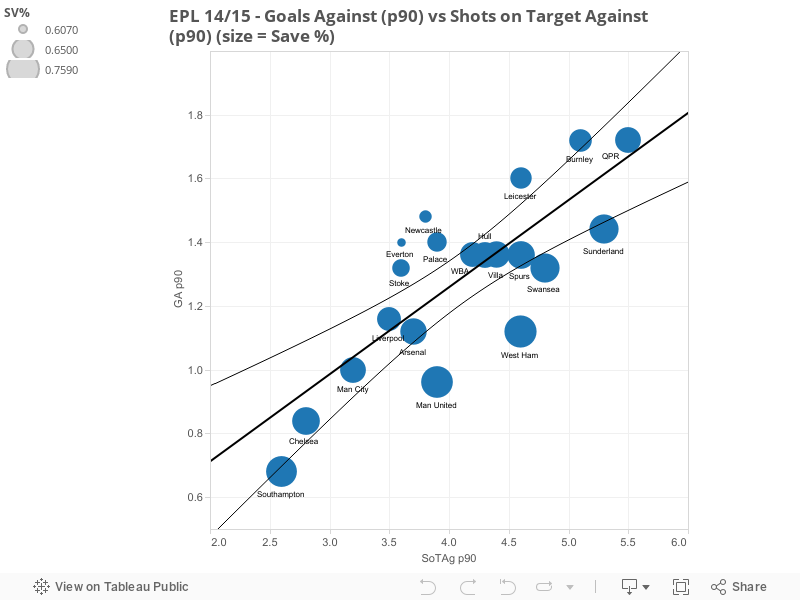
Goals Against vs Shots on Target Against
Goalkeepers are voodoo. Ask Everton. Pretty much, all of Everton's under performance in the league is down to their inability to stop the ball. They sit dead last in save % (table below), while last season they were 2nd. Everton have been both, slightly lucky (6th lowest shots on target) and really unlucky (league low save %) this season. Both these metrics should regress but it is too late for it to matter, this season.
On the opposite end of the voodoo spectrum, we have Man United, who are getting away with it, this season. 8th in shots on target against and De Gea bailing them out. This United team are riding the variance of their goalkeeper. Will it last? Crazier things have happened.
Another notable outlier is Sunderland. Pantillimon, since coming in to the side, has been the saviour. His performance is the reason they are not buried in the relegation places.
Another notable outlier is Sunderland. Pantillimon, since coming in to the side, has been the saviour. His performance is the reason they are not buried in the relegation places.
Here is the save% of each team (sortable).
| Team | Save % |
|---|---|
| Arsenal | 70.0 |
| Aston Villa | 69.1 |
| Burnley | 66.9 |
| Chelsea | 72.8 |
| Crystal Palace | 64.2 |
| Everton | 59.0 |
| Hull | 68.1 |
| Leicester | 65.4 |
| Liverpool | 68.4 |
| Man City | 69.0 |
| Man United | 75.9 |
| Newcastle | 61.6 |
| QPR | 69.2 |
| Southampton | 73.7 |
| Stoke | 64.6 |
| Sunderland | 73.8 |
| Swansea | 72.6 |
| Tottenham | 70.5 |
| West Brom | 69.5 |
| West Ham | 74.2 |
| Average | 69.0 |
* compiled using footstats.co.uk
Clarke
Thursday, 19 February 2015
Goals Against vs. Shots on Target Against (25 games)
Here is a viz created using Tableau:
Man United and West Ham are crazy outliers with very high save%'s keeping their seasons from being much worse.
On the other side, we have Everton and Newcastle who are serious outliers with poor save %'s. For Everton, they could very easily be up around 6th position with a league average save %.
Expect these 4 teams to all regress towards the league average save % of approximately 68%.
Subscribe to:
Posts (Atom)